
Health Surveillance Indicator: Teen Pregnancy Category: Reproductive Health Prepared: June, 2017 This indicator report is part of a series that informs the ongoing assessment of Toronto’s health status. For a full list of the indicators, please go to: www.toronto.ca/health
Public Health Relevance
Becoming pregnant during the teen years poses health risks to both the mother and the child. Pregnant teens are at increased risk for health problems such as anemia, hypertension and depressive disorders, while babies born to teen mothers are at increased risk for low birth weight and preterm birth. These adverse birth outcomes are associated with a higher risk of infant mortality, childhood morbidity and certain chronic diseases in adulthood. Teen pregnancy is also associated with social, educational and employment barriers.
Understanding trends, patterns, and population-level behaviours related to teen pregnancy provides evidence for planning, evaluating and modifying public health services and policies intended to promote the healthiest possible outcomes for pregnant teens.
Highlights
- Teen pregnancy, abortion and birth rates decreased in Toronto from 2004 to 2013.
- Toronto's rates for teen pregnancy, abortions and births were significantly higher than the rest of the Greater Toronto Area.
- Areas in northwest Toronto, East York and Scarborough had clusters of neighbourhoods with higher teen pregnancy rates than the city overall.
- Toronto teens with lower incomes tended to have higher rates of pregnancies, abortions and births.
Trends Over Time
Teen pregnancy, abortion and birth rates in Toronto decreased from 2004 to 2013.
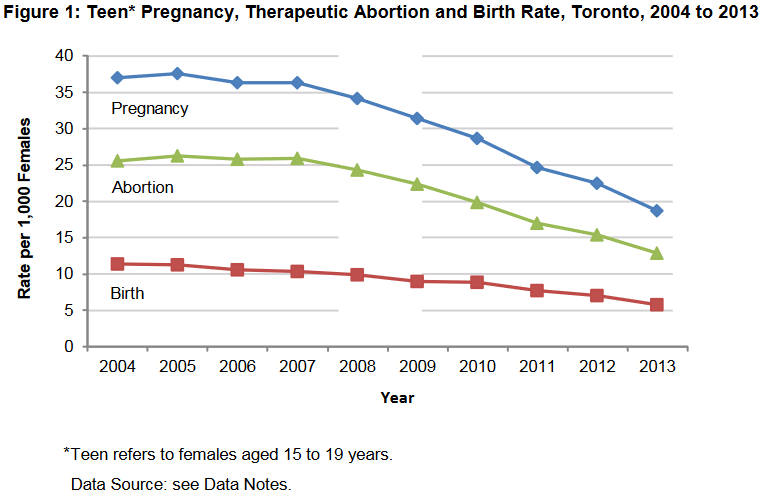
Figure 1 shows the number of pregnancies, therapeutic abortions and births per 1,000 women aged 15 to 19 years in Toronto between 2004 and 2013.
Teen pregnancy decreased significantly from about 37 pregnancies per 1,000 women in 2004 to 19 in 2013. Teen abortion decreased significantly from about 26 abortions per 1,000 women in 2004 to 13 in 2013. Teen births (including both live and stillbirths) decreased from about 11 births per 1,000 women in 2004 to 6 in 2013.
Regional Comparisons
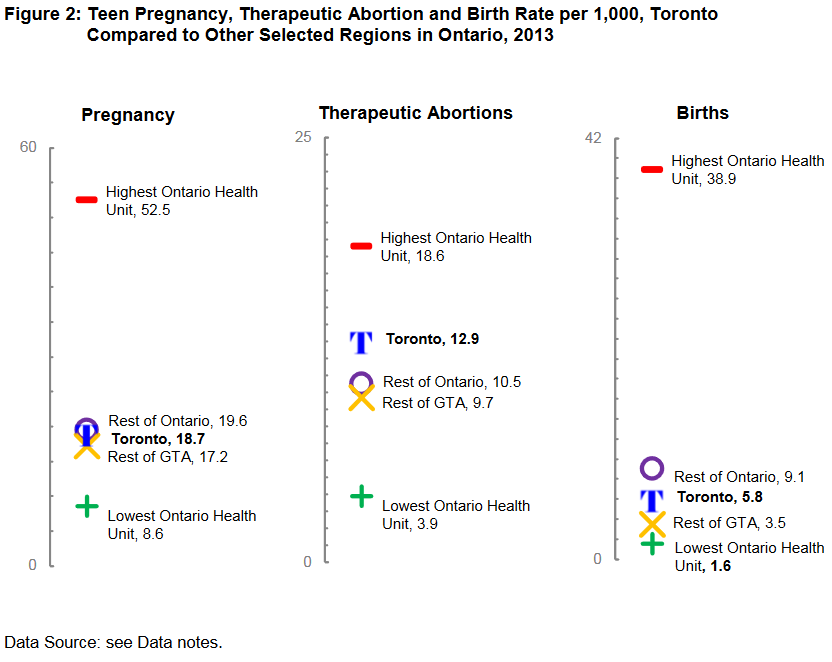
Toronto's rates for teen pregnancy, abortions and births were significantly higher than the rest of the Greater Toronto Area.
Toronto's teen pregnancy rate was significantly higher than the rest of the GTA but not significantly different from the rest of Ontario. Toronto ranked 8th of the 36 health units in Ontario, with the first ranked health unit having the lowest rate. Toronto's teen abortion rate was significantly higher than the the rest of the GTA and rest of Ontario. Toronto ranked 27th of the 36 health units in Ontario, with the first ranked health unit having the lowest rate. Toronto's teen birth rate (live and stillbirths) was significantly higher than the the rest of the GTA and significantly lower than the rest of Ontario. Toronto ranked 5th of the 36 health units in Ontario, with the first ranked health unit having the lowest rate.
Toronto Neighbourhood Comparisons
Areas in northwest Toronto, East York and Scarborough had clusters of neighbourhoods with higher teen pregnancy rates than the city overall.
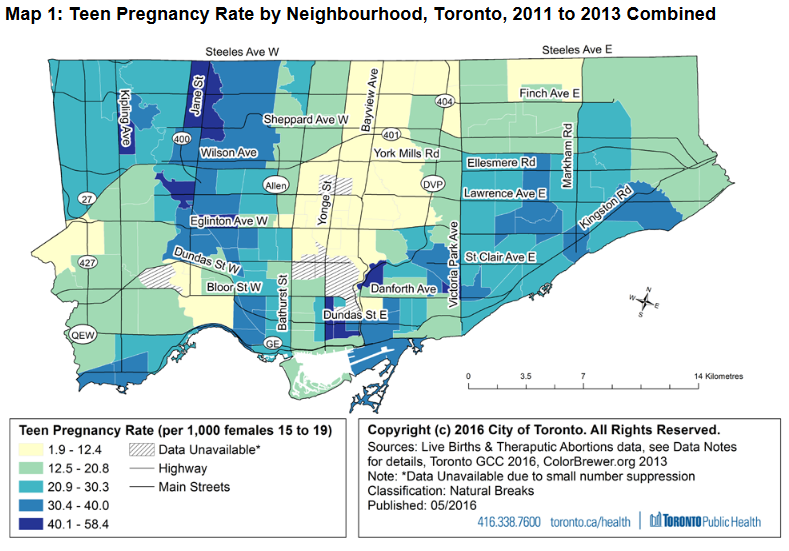
Map 1 shows teen pregnancy rate by Toronto neighbourhood for 2011 to 2013 combined.
Areas in northwest Toronto, East York and Scarborough had clusters of neighbourhoods with higher rates than the city overall. This pattern is consistent with that for the general pregnancy rate for women 15 to 49 years. Some neighbourhoods with significantly higher rates include:
- Beechborough/Greenbrook
- Black Creek
- Broadview North
- Church-Yonge Corridor
- Glenfield-Jane Heights
- Keelesdale -Eglinton West
Areas in central Etobicoke, central Toronto, and North York had clusters of neighbourhoods with lower rates than the city overall. Some neighbourhoods with significantly lower rates include:
- Bedford Park-Nortown
- Forest Hill South
- Lawrence Park North
- Markland Woods
- Princess-Rosethorn
- Rosedale-Moore Park
Teen pregnancy rates are not reportable for neighbourhoods with fewer than five pregnancies.
Pregnancy Outcomes and Socio-demographics
Teens with lower incomes tended to have higher rates of pregnancies, abortions and births.
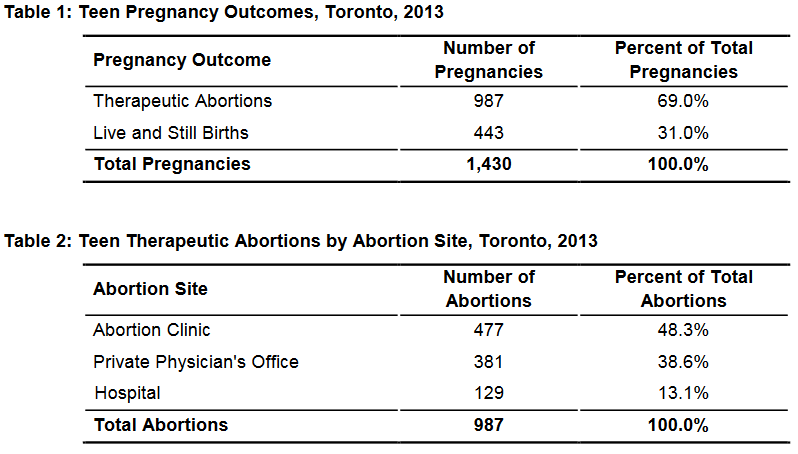
Table 1 shows teen pregnancy outcomes for Toronto in 2013. Nearly seven out of ten (69%) teen pregnancies ended in abortions.
Table 2 shows teen abortions by abortion site. In Ontario, abortion services may be accessed at hospitals, abortion clinics and private physicians' offices. Abortion clinics are the most common setting for teens to access these services (48%), followed by private physician's offices (39%). Fifteen percent (15%) of teen abortions were performed in a hospital.
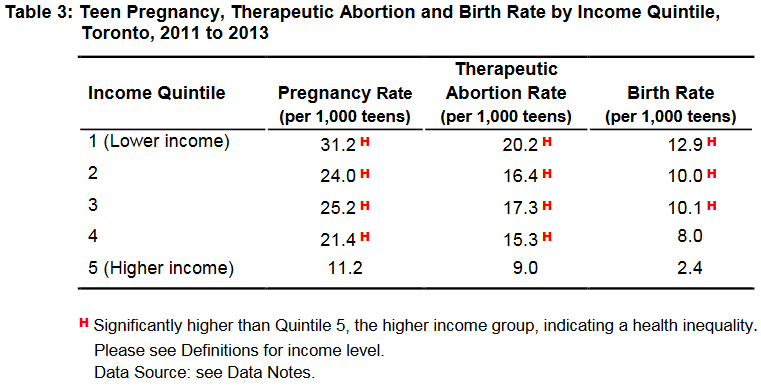
Table 3 shows the number of teen pregnancies, abortions and births per 1,000 females by income quintile for the years 2011 to 2013 combined. Quintile 1 includes the areas in Toronto with the highest percent of people living below the low income measure (LIM), making it the lowest income quintile. Quintile 5 includes the areas in Toronto with the lowest percent of people living below the LIM, making it the highest income quintile. Quintile 1 (the lowest income group) as well as Quintiles 2, 3 and 4 had significantly higher rates than Q5 (the highest income group) for Toronto's teen pregnancy and teen abortion rates. The teen birth rates for Quintiles 1, 2 and 3 were significantly higher than Q5.
Data Notes
Notes
- Therapeutic abortions (TAs) in Ontario are performed in three health-care settings: hospitals, free-standing abortion clinics and private physicians’ offices (PPO). Historically, TA data released by the Ontario Ministry of Health and Long-Term Care captured only reports of TAs performed in hospitals and clinics. In 2011, the Ministry revised the reporting criteria to include TAs performed in PPOs. This revision was informed by research on access to abortion services in Ontario. Based on the revised criteria, the Ministry updated the TA data for 2001 to 2009 and issued the data file in spring 2011. All publications released by Toronto Public Health after June 2011 requiring the use of abortion statistics are based on the updated data. Abortion and pregnancy statistics based on the updated data are therefore higher than in previous reports.
- The adjusted numbers of therapeutic abortions is used in this analysis as per recommended practice. The adjusted number excludes a second abortion within 40 days of the first because the second abortion was likely a complication from the first procedure. For most age groups and most years, the relative difference between the total number of TAs and the adjusted number was less than 1%.
- Significant differences were estimated using overlapping confidence intervals. Although this method is conservative (α < 0.01) and most appropriate when comparing mutually exclusive groups, it was chosen as an objective means of making conclusions on population-based data. Also note that the multiple comparisons performed in the analysis were not taken into consideration when choosing the level of significance to test.
- Time trend analysis is based on data from the most recent 10 year-period or, when there are fewer than 10 years of data, from the earliest available.
- Map 1 is based on three years of data combined in order to obtain a sample size large enough to analyze the data at smaller geographic levels. By combining multiple years of data, changes over time in and between geographic areas may be hidden. Rates are classified by Natural Breaks, which is an algorithm that creates break points where there are relatively big jumps in the data values. The resulting class breaks tend to group similar values and maximize the differences between classes.
- Pregnancy rates for 2011 to 2013 are based on preliminary population estimates and therefore subject to minor adjustments in the future.
- Toronto is compared to the rest of Ontario (Ontario with Toronto removed) as opposed to the Ontario total because Toronto comprises a large proportion of the Ontario population. Toronto is also compared to the rest of the GTA (Greater Toronto Area) for the same reason.
Definitions
GTA excluding Toronto means the Greater Toronto Area (GTA) with Toronto removed from the GTA data.
Income Quintiles: Five groups, each containing approximately 20% of the population, were created by ranking Toronto's census tracts based on the percent of residents living below the Statistics Canada after-tax Low Income Measure (LIM), based on 2010 income tax filer data. Quintile 1 includes the census tracts with the highest percent of people living below the LIM and is therefore the lowest income quintile. Quintile 5 includes the census tracts with the lowest percent of people living below the LIM, making it the highest income quintile. LIM is an income level set at 50% of the median family income in Canada in a given year, adjusted for household size.
Number of Pregnancies is estimated by summing the total number of hospital deliveries (both live and stillbirths) and therapeutic abortions captured by hospital inpatient discharge and ambulatory care data and medical services data which include abortions performed in both abortion clinics and private physicians' offices. The total number of pregnancies is underestimated because spontaneous abortions (i.e. miscarriages) and home deliveries are not captured by the data sources used for this analysis. This in turn results in an underestimation of pregnancy rates and birth rates for Toronto.
Ontario excluding Toronto means Ontario with Toronto removed from the Ontario data.
Teen Birth Rate is the number of hospital deliveries (both live and stillbirths) by females 15 to 19 years old per 1,000 females in this age range.
Teen Pregnancy Rate is the number of pregnancies experienced by females 15 to 19 years old per 1,000 females in this age range.
Teen Therapeutic Abortion Rate is the number of therapeutic abortions experienced by females 15 to 19 years old per 1,000 females in this age range. Therapeutic Abortion refers to the deliberate termination of a pregnancy resulting in the death of the fetus or embryo, otherwise known as induced abortions. This term does not include spontaneous abortions or miscarriages. Abortion data are captured in three data sources: OHIP paid claims, hospital discharges and ambulatory care visits. These aggregated data are prepared by the Ministry of Health and Long-Term Care.
Sources
Income data: Statistics Canada. (2012) Table F-18 annual income estimates for census families and individuals (T1 Family File).
Live Birth and Therapeutic Abortion data, Inpatient Discharges and Hospital and Medical Services Data, 2004-2013; Ontario Ministry of Health and Long-Term Care, IntelliHEALTH ONTARIO, Date Extracted: February 2015 (Inpatient Discharges) and March 2015 (Hospital and Medical Services Data).
Used in:
- Figures 1 and 2
- Tables 1, 2 and 3
- Map 1
Denominator data:
Population for Toronto and Larger Areas: Population Estimates 2004 to 2013, Ontario Ministry of Health and Long term Care, IntelliHEALTH ONTARIO. Date extracted: July 2015 Used in:
- Figures 1 and 2
- Tables 1 and 2
Population for Neighbourhood or Service Delivery Areas: 2011 Canada Census, Statistics Canada. Used in:
- Map 1
- Table 3